







 5 min read


Guest insights from Ayal Cusner, Quantitative Analyst to Portfolio Manager, Motley Fool Asset Management Sitting in for Shelby McFaddin
When I was a kid, I folded a lot of origami.
Not the paper-crane-in-homeroom kind — the intricate stuff, models that took hours, where one bad crease forty steps in meant starting over with fresh paper. Occasionally a friend liked one enough to ask what I’d sell it for.
That transaction never once happened. I’d name a price anchored to the three hours and the ruined first attempt; they’d hear a number that was way too much for a folded piece of paper. So I stopped selling and started gifting, which was better for my friendships and much better for my ego.
Years later, working where behavioral finance meets quantitative investing, I still catch myself pricing my models the way I priced that origami: by the hours I put into them, not by what they're worth to anyone else. So let's talk about models. Not the paper kind, and not (only) the quantitative kind, but the ones we all carry around and almost never put up for sale: the mental kind.
Why you can’t sell origami
For the sake of this discussion, let’s define the endowment effect as the tendency to value something more highly simply because you own it.
The canonical demonstration is a coffee mug. In 1990, Kahneman, Knetsch, and Thaler handed Cornell coffee mugs—retail price $6.00—to every other student in a room, then opened a market.1 Theory has a clean prediction: the mugs were assigned at random, so about half should trade.
Barely any did. Across five rounds, four to eight mugs changed hands where theory predicted roughly eighteen, because the median owner wanted between 1.8 and 3.8 times what the median buyer would pay. Same mug, same room. The only thing separating the two valuations was which side of the aisle you’d been sitting on when the experimenter walked by.
That’s not a quirk of undergraduates and drinkware. You renovate a house, pour eighteen months into it, and an appraiser hands you a number reflecting precisely none of that. The market doesn’t price your effort. It prices the house.

Crease patterns, or how to burn a bridge with your professor
Here’s where it gets uncomfortable.
I’m a couple of years into a PhD in economics at George Mason, and I’ve learned that economics professors are magnificently willing to challenge established norms — right up to the boundary of their own published work. That’s a third rail. I’ve had wonderful conversations by staying off it and some deeply awkward ones by stepping on it.
I don’t think that’s ego—well, mostly not. It’s an endowment effect operating on something far more valuable than a mug. Poke at a paper’s conclusion, and you’re not questioning one result; you’re asking how far back the unfolding goes. If this premise falls, what about the three papers built on it?
Which brings me to the actual claim of this letter: your mental model is the most valuable endowment you own. Not your portfolio—your model. It generates every future decision and, just as importantly, your confidence in them.
That second part matters more than it sounds. Emotions don’t take over when things get bad; they take over at the boundary where your model can no longer explain what’s happening. Inside the boundary, a 30% decline is a drawdown you were told about. Outside it, the same 30% is evidence you’ve fundamentally misunderstood something—and that is what makes people sell. The market has historically been indifferent to investors expressing emotion. Occasionally it charges admission.
So there’s no opting out, and the endowment effect guarantees you’ll overprice the thing. But there is a way to fold it so it doesn’t tear the first time you have to open it up.
Folding blind: why I don’t do chart patterns
Origami is all about fundamentals. Most models start from a surprisingly small number of “bases” you need to master. Sloppy folds early on compound, eventually sending your work into the paper bin. My investing guidance is no different: start with a sound mental model as a base, and don’t let mental mistakes compound over time.
Early in grad school, I entered Interactive Brokers’ algorithmic trading olympiad.
My strategy was pure pattern matching. Take a stock’s price chart, scan history for the moments that looked most similar, bet on whatever happened next last time. No fundamentals, no economics, just shapes. It backtested beautifully after some, erm, tweaking. Then I entered it in the competition, where it performed like hot garbage.
That felt terrible for about a week, but it was actually the best thing that ever happened to my mental model—not because chart patterns don’t work, but because it gave me a calibrated sense of how much I did not yet understand. Had it won, I might have spent five years getting better at squiggly shapes. The lesson wasn’t “you’re wrong”; it was “your expectations were wildly out of line with the base rate.” Very different repairs: one needs a refold, the other a ruler.
So let me share one of the most useful mental rulers I know. A very sharp quant named Jonas once showed me what he called the God Portfolio.
The setup is deliberately unfair. Go back to any month in history and take the 500 largest U.S. companies. Now cheat—look forward, see which ones delivered the highest total returns over the next five years, buy the top 25 in equal weight, and never touch them again. Perfect foresight, no mistakes.
Then ask the only question that matters: What did they have to sit through to collect it?
I rebuilt this over every month-end from December 1995 through June 2026—307 overlapping five-year cohorts—across a grid of horizons and portfolio sizes.2
| Holding period | Portfolio | Mean total return |
Mean max drawdown |
Shallowest drawdown ever |
|---|---|---|---|---|
| 1 year | 25 stocks | +99% | −14% | −4% |
| 3 years | 25 stocks | +235% | −24% | −9% |
| 5 years | 25 stocks | +348% | −31% | −12% |
| 10 years | 25 stocks | +934% | −41% | −21% |
| 20 years | 10 stocks | +6,475% | −54% | −39% |
Read that right-hand column again. Not the average—the best case. Out of 307 perfect-foresight five-year portfolios, the luckiest one still went down 12%. Three quarters fell more than 20%; nearly half fell more than 30%. And on average the pattern is relentlessly monotonic: hold longer or concentrate tighter and you make more and suffer more. There is no cell where extra return arrives without extra pain attached.
The part that surprised me was the bottom row. That 20-year, 10-stock portfolio compounds at 22.5% a year—$1 becomes $66—while eating an average 54% drawdown, 11 percentage points deeper than simply owning all 500 companies, and deeper in 98% of cohorts. Perfect foresight didn’t buy a smoother ride. It bought a rougher one, but it paid you for the trouble.
Make it concrete. The best possible 25-stock portfolio you could have assembled on June 30, 2021 returned +596% through this June, and even the worst of its 25 names returned +283%. It’s a roster you’d recognize: Micron* up nearly 1,300%, then Seagate, Western Digital, NVIDIA, Broadcom.
Along the way, it fell 31%, while the index it came from fell 25%. Hand-delivered by an oracle, and you were still down almost a third and doing worse on the way down than the plain vanilla alternative. Once you’ve seen that, “I found a pattern that avoids the drawdown” stops sounding clever and starts sounding like a category error.
Why quants are boring at dinner parties
My friends know I do something at Motley Fool Asset Management, so I occasionally get asked for stock tips. I’m a catastrophic disappointment on this front. Corner a bottom-up stock picker at a party and you’ll leave with a dozen names and a great time. Corner me, and you’ll leave with a dozen signals—“so let me tell you about our adjusted book-to-price calculation”—and a strong desire to refresh your drink.
For a quant, each score is an investing principle rendered in something measurable. A whole cluster of ours is trying to measure one idea: quality—betting on companies with characteristics that come with higher stock prices: profitability, growth, and stability.
The research arrived in a stream of continuous bursts, mostly between 2010 and 2015. Robert Novy-Marx showed that gross profits-to-assets predicted returns about as well as book-to-market did—profitability as “the other side of value.”3 Fama and French folded it into their five-factor model as RMW, robust minus weak.4 And Asness, Frazzini, and Pedersen built the kitchen-sink version: score companies on profitability, growth, and safety, go long the best and short the worst, and you have Quality Minus Junk.5 At Credit Suisse, Michael Mauboussin was awakening new generations of analysts to the importance of ROIC6—return on invested capital. Other waves of research had crested over strategies like value, momentum, and operating accruals in the 90s, but Quality’s rise was largely a product of the 2000s and beyond.
The economic case rests on persistence. High returns on invested capital shouldn’t survive contact with competition—that’s the whole point of competition. When they do survive, something is protecting them: switching costs, scale, a brand, a network, a moat. Investors have historically underpaid for how long those protections last, and quality strategies collected the difference.
Obvious conflict of interest: quality is a substantial part of how my colleagues here think about companies. Our Four Pillars—Management, Culture & Incentives; Economics; Competitive Advantage; Trajectory—are a bottom-up expression of a closely related idea.
How many folds back?
Let’s use AQR’s U.S. QMJ series through June 30, 2026.7 Over 69 years, a dollar became $10.65, 99.2% of ten-year windows were positive, 100% of twenty-year windows were, and the worst twenty-year stretch on record still returned +21%. And as of June 30, the factor sat 36% below its high, the deepest drawdown in the entire record, 32 months from an October 2023 peak, with four consecutive losing years.
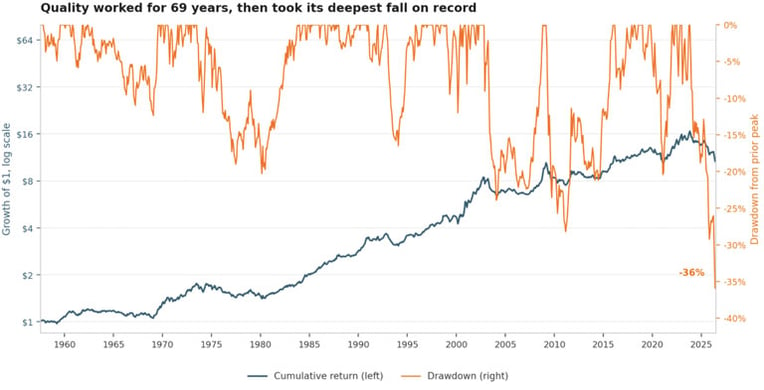
AQR Quality Minus Junk factor, U.S. equities, monthly, July 1957 to June 2026. Cumulative return compounds the self-financing long/short excess return.
Quality worked for 69 years, then took its deepest fall on record
The tempting reaction is demolition: quality is broken, AI dissolved the moats, tear it up and start over. So let’s do the opposite and unfold it deliberately, counting the creases from the outside in.
The outermost fold is the idea that quality works often. It never did. Barely more than half of individual months and only about two-thirds of rolling twelve-month windows have been positive across the whole record. Anyone carrying that assumption was carrying something the research never claimed. Discard it; nothing was resting on it.
Next is the idea that quality is a short-horizon anchor, that when markets get strange, the high end of the quality spectrum cushions you. The last three years have refuted this outright. It is the worst three-year stretch in the series by a wide margin, and it arrived precisely when it would have been most welcome. This is the fold that actually costs people money, and it has to come apart.
Next is the idea that a long/short factor’s drawdown is a verdict on the premium itself. This one is a measurement claim wearing an economic costume. A long/short portfolio is, by construction, short something—and what it is short behaves very differently in a market compounding in the mid-teens than in one compounding at five. That is a fact about the instrument, not about the businesses inside it. Refold this one carefully rather than throwing it out.
Underneath sits the moat question, and this is where the argument genuinely lives. If a capable model can rebuild a feature set cheaply, the half-life of a switching-cost advantage may be shorter than it looked in 2019. Meanwhile, the capex cycle has made scarce physical capacity more than a screen built around capital efficiency would ever have guessed. Both are worth arguing about. But notice what they are arguments about: which businesses actually have durable advantages, and for how long. Not whether durable advantage is worth paying for.
And at the bottom: high returns on invested capital should not survive contact with competition, and when they do, something is protecting them, and the market has historically underpaid for how long that protection lasts. Nothing in the last three years touches this. Every layer above it is a lousy approximation of it.
So count the creases. One assumption discarded that was never load-bearing, one discarded that genuinely hurt, one refolded, one live argument that belongs to analysts rather than factors—and the core principle sitting underneath, untouched. The five-, ten-, and twenty-year records all remain inside what history already contained; it is the three-year window, and the way we read a long/short series, that broke.
That is the useful thing about unfolding on purpose instead of crumpling the whole model. Most of what breaks turns out to be scaffolding.
And I cannot stress enough that none of this is a prediction that quality is about to rip. I have no idea. If you know a guy who does, please come find me.

Fold carefully
There’s a difference between worse than expected and worse than the model said was possible. The first is a calibration problem, and the fix is a ruler; the second is structural, and the fix is a refold. You can only tell them apart if the base rates were written down before you needed them. Otherwise you get the two failure modes we opened with—the professor who won’t let you near the premise, and the kid who priced three hours of folding into a piece of paper.
I couldn’t sell that origami because I’d priced in every hour of effort and the market had no interest in my effort. Your mental model is the same, with one difference: you can’t gift it away, and you can’t stop using it. So fold it carefully, write down what it actually predicts—including how bad the bad case is supposed to feel—and when the bad case arrives, check the paper before you tear it.
Perfect foresight came with a 31% drawdown. Whatever the rest of us are running won’t be gentler than that.
Until Shelby’s back,
Ayal
Related Posts

You Can’t Sell Origami

McFaddin on the Markets
Guest insights from Ayal Cusner, Quantitative Analyst to Portfolio Manager, Motley Fool Asset...

This Indicator Is Spookier Than Halloween Itself
Come Halloween, plenty of people will be dressed up and pretending to be something they’re not....

Search the Insights Blog