
At the beginning of this year, investors were experiencing a literal high with peak returns following the remarkable recovery from the initial pandemic lockdowns. But lethargy rapidly kicked in with the economy and stock market’s steady decline. Unfortunately, that’s not all that’s going on. Geopolitical risks remain elevated from the Ukraine/Russia war, tensions surrounding China and Taiwan, troubles in the U.K., and more. And we all know about inflation’s resurgence. Even the NFL is experiencing a weird twist of fate as greats like Tom Brady and Aaron Rodgers are faltering while the forecasted "lowly" New York teams are vying for playoff spots! What is going on???
We may have an answer. No, we’re not here to analyze the problems of the Bucs and Packers (or comment on whether the Giants and Jets will make the post-season) or even opine on how geopolitical tensions may play out. But since we’re asset managers, we feel we can provide our perspective on the stock market and your money.
Investors’ #1 question: When will I recover my market losses?
First, no one knows when the market will turn or how the future trajectory of returns will look. In the past, we’ve talked about how the market drops often but recovers quickly. And in any given year, that is true. But, to gain insight into deep drawdowns and loss recovery, we looked through history at similar market drops. Here’s what we found:
From 1942 through 2021, the U.S. stock market experienced 14 bear markets, where it fell at least 20%. Through the first three quarters of 2022, the S&P 500 has declined 25%, firmly in bear territory.1
Fortunately, there’s good news that keeps some investors sane during bear markets. 80 years of data show that historically up markets lasted longer, occurred more frequently, and delivered robust returns compared to down markets.2
- From 1942 to 2021, the average bull market (blue) lasted 52.8 months with a cumulative total return of 155.6%.
- From 1942 to 2021, the average bear market (yellow) lasted 11.3 months, with a cumulative loss of 32.1%.
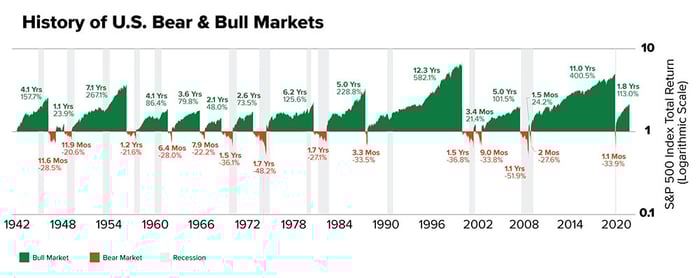
Source: First Trust Advisors L.P., Bloomberg. Daily returns from 4/29/1942-12/31/2021. Past performance is no guarantee of future results. These results are based on daily returns-returns using different periods would produce different results. The S&P 500 Index is an unmanaged index of 500 stocks used to measure large-cap U.S. stock market performance. Investors cannot invest directly in an index. Index returns do not reflect any fees, expenses, or sales charges. This chart is for illustrative purposes only and is not indicative of any actual investment. These returns resulted from certain market factors and events that may not be repeated in the future.
Let’s highlight that again: During the 79-year time period studied, bull markets historically lasted 41.5 months longer and delivered a 123.5% higher cumulative total return than bear markets, on average.
We hope this provides comfort for those of you who have time to wait for a recovery and the ability to withstand the current losses. But we also understand that some of you may feel nervous because time may not be on your side. For example, if you count on your investments to fund your retirement or are planning on buying a house next year, you may wonder if you’ll recover your losses before you run out of money or plan your purchase.
Historically, how long did loss recovery typically take?
We need to do some relatively complicated investment math to determine how long it has historically taken to recover market losses. We’ll spare you the details of the calculations but suffice it to say that to recover losses, the market needs to gain more than the market lost. In other words, if the market lost 10%, it must earn 11% to make up for that loss. Or if the market lost 30%, it needs 43% to break even.
Instead of assessing all bear markets, we decided to look at seven of the worst bear markets in the modern stock market era to gain perspective on the average length of time it generally has taken to recover steep market losses. Some of these periods from 1968 to 2021 generally resemble today’s environment. For example, the periods of 1973-1974 and 1980-1982 can offer insights into similar economic conditions, while 2000-2002 and 2007-2009 describe asset bubbles.
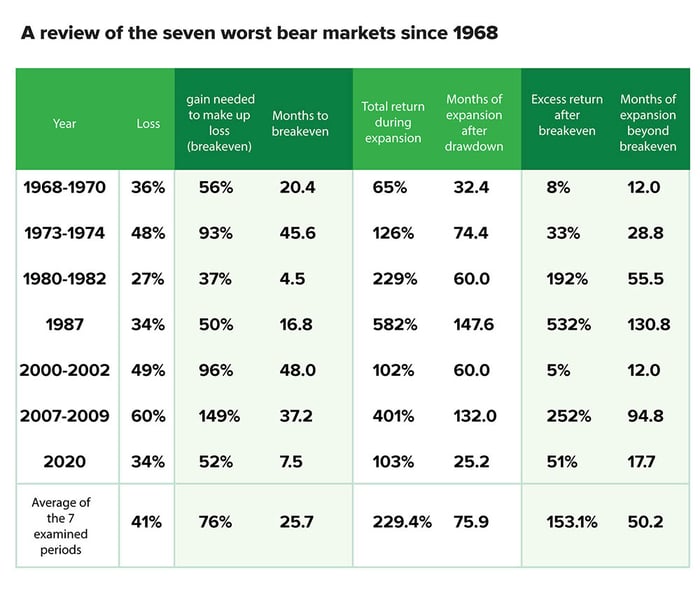
Source: Data from FirstTrust and Yahoo!finance. Calculations by Motley Fool Wealth Management.
There are several takeaways from these data, but the primary one is that during the worst bear markets since 1968, stocks declined 41%, on average. The average gain needed to make up for those losses was 76%. It took the market, on average, just over two years to recover those losses, and the market continued to grow, on average, for another four years and gained another 153% on average.
In today’s terms
As we mentioned, the S&P 500 has declined 25% this year.1 So, based on that percentage, it needs to rise by 33% to make up for that loss. How long could that take?
We could compare today’s economy and market loss with past periods to answer the question. No period exactly reflects today’s market or economy, so we cannot draw a precise comparison, but we can show periods with generally similar factors and their loss recovery time frames.
- Today’s rising inflation, interest rates, and slowing growth are similar to the 1973-1974 and 1980-1982 periods. But the labor market is strong compared to the high unemployment back then. The market decline of the ’80s is most like today. So while it’s not an apples-to-apples comparison, we can note that it took only 4.5 months to make up that loss in the early ‘80s. Conversely, the ’70s drawdown was more severe, and it took nearly four years to climb out of that hole.
- Some investors think we may be in a real estate bubble due to the significant rise in home prices coupled with mortgage rates that have taken off and are now at 20-year highs.3 But unlike during the 2007-2009 collapse, today, we believe most financial institutions should generally have stronger balance sheets, and that better homebuyer vetting should make mortgage defaults less likely compared to the 2000s.
The final word
We know we didn’t definitively answer how long it takes to recover your losses. That’s because no one knows. Past performance is not necessarily an indicator or a guarantee of future performance. But past experiences can provide three important takeaways:
#1: Historically, the market has recovered from every drawdown over time, even steep and prolonged declines. And it had continued to grow beyond the losses incurred.
#2: On average, it has taken under two and a half years to recover market losses when severe declines occurred during the worst bear markets.
#3: Investors who sell out of the market during a drawdown and do not reinvest may not recover losses.
There’s another essential piece to this puzzle. If you can continue putting money away in your retirement or other investment accounts during this downturn, we believe you should recover your losses faster. How? Because we believe generally, you’ll be buying shares at depressed prices, and thus you should be growing from a lower base when the market turns up.
We get it—this advice is the opposite of what your gut tells you to do. (We really do understand because we’re investors, and we see our retirement accounts, children’s college funds, and other investments falling too.) But if you have the time horizon and money to do this, we think your long-term growth will likely be higher. And if you don’t have the time because you need your investments to pay your everyday expenses, try to pull retirement income from other sources right now.
Related Posts

Sell in May and Go Away? Here’s Why Investors Shouldn’t Take the Summer Off.
Back in 1986, The Stock Trader’s Almanac coined the phrase “sell in May and go away” to highlight...

There are 4,740 ETFs out there. How can you choose where to put your investment dollars?
Ever tried to figure out what to order for dinner on a Friday night? Perhaps you can relate to the...

The Same Stream Twice

Mann on the Street
“My wallpaper and I are fighting a duel to the death. One or the other of us has got to go.”
–...