

Some people compare investing to the game of darts. During strong up markets, it can appear easier to pick winners since generally many stocks tend to rise. This is akin to throwing a dart at a board that’s riddled with rising stocks and hitting any part of the dartboard—you’ll probably hit a stock that goes up. But when the market is falling or moving sideways, few stocks are rising, and a thrown dart can often miss them and fail to land on a winner.
This analogy is the reason why diversification is an important concept for investors. Because not every style, geography, asset class, sector or manager’s prowess wins every single time. That’s why in darts, you have several opportunities to hit the board!
So, as we look at the environment we’re in right now—coming off a double-digit down year with little direction on what may happen this year—one of the investing strategies that stands out to us is management style. Specifically, we believe that when most stocks are NOT rising, then stock-picking should be able to perform better than indiscriminately holding a broad basket of stocks. In other words, to us does holding an index mutual fund or index ETF make sense in today’s environment or should you invest in a fund where an investment team actively picks the securities?
Before we begin, let’s get some nomenclature out of the way: Often investors speak about active funds or actively managed investments as compared to passive ones. By active, they mean there is a professional investment team actively analyzing companies and picking specific stocks to buy or sell. And by passive, they mean the stocks held are ones also held in an index that the fund tracks. In passive investments, the managers do not pick any stocks. Rather they mimic an index. Ok, now that the jargon is out of the way, let’s look at the two styles of management.
Performance of an index ETF vs stock picking
When we look at average performance over the most recent decade, there’s certainly a general argument to be made in favor of the index ETF approach. In fact, since 2010 (corresponding to the end of the Global Financial Crisis (GFC)) through Oct. 2022, investing in an S&P 500 index ETF could have made you about 13% more on your return before fees than the average actively managed U.S. large cap core fund.1
However, when we take a step back and look longer term, we notice that, generally, passively managed indexing and actively managed U.S. large blend stock picking have historically had a cyclical relationship—they both have experienced periods of outperformance.
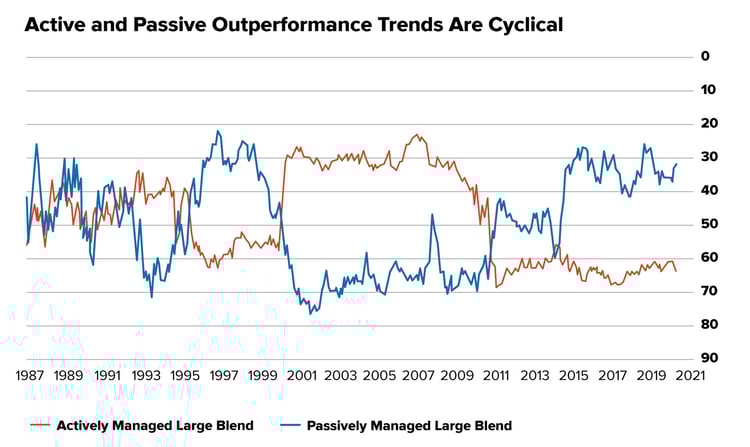 Source: Morningstar and Hartford Funds, Feb. 2022. Data shows rolling monthly 3-Year periods from 1987-2021.
But when we dig deeper, we notice a glaring trend: During market corrections (those down markets where hitting a winner on a dartboard is harder), actively managed large blend stock picking historically has tended to beat the benchmark (represented by the S&P 500). Let’s examine this more closely.
Active management had a solid year in 2022
Generally active U.S. large cap equity fund managers picking stocks did comparatively well in the 2022 market downturn—with nearly half beating the S&P 500—as compared to the previous year. For comparison, just 15% of actively managed large-cap funds beat their benchmarks in 2021 when the market was up 28.7% .2
In addition, 64% of managers of U.S. large-cap value fund managers beat the Russell 1000 Value index, and 60% of small-cap value and small-cap core bested their S&P style benchmarks.3
This outperformance is a shift from the most recent decade when indexing generally beat stock pickers in many asset classes. And not all asset classes had the same positive results in 2022. Let’s examine why.
How have actively managed funds historically performed in significant down markets?
Generally speaking, actively managed large-cap blend funds specifically benchmarked to the S&P 500 have historically underperformed in strong environments and have shined when the market is turbulent or uncertain.
Before we explain further, first let’s explain why we tend to talk about “U.S. large cap blend.” This universe of funds tends to look the most like the stocks held in the S&P 500 index which is also believed to be the most efficient universe of stocks. Some investors believe that passive index investing works best in efficient stock categories, so we believe one could reason that passive indexing should do well in this category.
For example, active stock-picking funds outperformed in all three years of the Global Financial Crisis from 2007 through 2009 by more than six percentage points (before fees).4
Looking back a bit further, U.S. large-cap active stock picking funds underperformed against the S&P 500 during the tech boom of the late 1990s, but dramatically outperformed that benchmark after the bubble burst. For those of you who remember, during the late 1990s the dartboard was flush with unprofitable young internet companies that the market loved (at least until the bubble burst!). In fact, actively managed large-cap blend funds beat the S&P 500 every year from 1999 through 2005, after underperforming the previous five years.
This last timeframe brings up a good point. Historically actively managed stock picking funds have not just tended to outperform in years the market was down—they also have generally done well during some turbulent initial rebound periods.5 For example, 2003 through 2005 were all positive years for the S&P 500, and actively managed U.S. large-blend stock-picking funds significantly outperformed against the S&P 500 during those years.6
This chart shows past down-market periods from 1987 to 2020 and the performance of active stock-picking and passive funds during that period. Out of the 27 periods, active stock-picking funds outperformed in 19 of them—or 70% of the time—by an average of 1.7% before fees.7 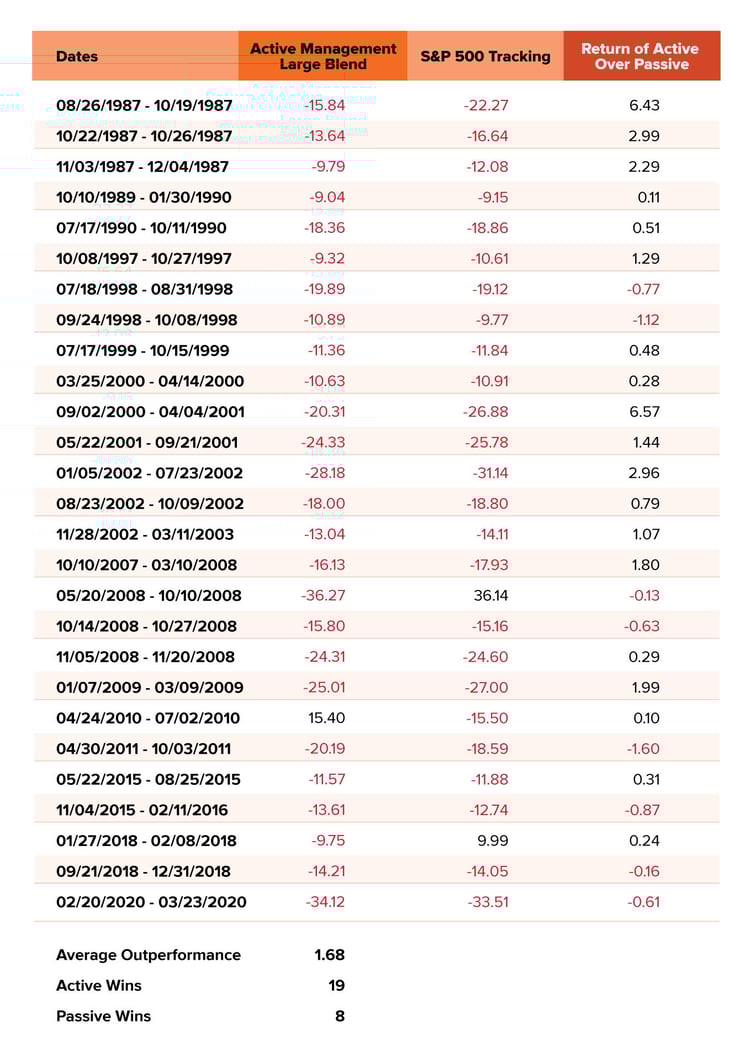
Footnote: Active Large Blend is made up of funds from the Morningstar Large Blend category that are not index or enhanced index funds. S&P 500 Index Funds are represented by the Morningstar S&P 500 Tracking category. All performance shown gross of fees.
It’s also important to note that active manager outperformance tends to increase with the severity of the down market. During the largest down markets during this same period, the typical active stock-picking funds outperformed the S&P 500 by a margin of about 2.4% before fees.8
Why have U.S. large-blend actively managed funds outperformed against the S&P 500 in some of the past tough times?
We think there are a few potential reasons for the historical, general outperformance of active stock-picking funds in certain years. For one thing, passive investments don’t assess individual risk events like active managers do, and this can become more of a factor in uncertain market climates.
Plus, it seems to us that favorable company fundamentals—such as the strength of the management team, competitive advantages, financial robustness, consumer loyalty, and market opportunities—may hold up better when the market is weak. Case in point—think of all the unprofitable growth stocks that were trading for upwards of 50 times sales in the recent bull market that began after the GFC and ended in 2022. Many active managers who rely on their fundamental analyses may have missed out on some big winners when the market’s “tide was rising all boats.” Thus, they may have underperformed against an index that held the entire basket of stocks. But when the tide receded and only the strong companies stayed afloat, we believe active stock-picking funds were likely better positioned.
The bottom line on active management in down markets
We’ve thrown a lot of statistics at you about how actively managed investments have performed in previous downturns, but it’s important to keep in mind that every market environment is different and past performance doesn’t guarantee future results. All investment involves risk and may lost money (including principal).
For example, the 2008-09 down market was particularly harsh on banks and other financial stocks, while the 2022 downturn hit high-growth companies especially hard, and these created two different sets of opportunities for active fund managers. But as evidenced above, neither U.S. large-cap blend (active stock picking) nor the S&P 500 (ETF indexing) wins all the time. While those active funds shown won a majority of the time in down markets, the S&P 500 index has also come out on top.
So we think having the ability to switch between active and passive management, or perhaps, even better, combining active and passive ETFs in your overall portfolio, could be the best of both worlds—where you could potentially have more exposure to successful management styles over the course of the market cycle.
Related Posts

Sell in May and Go Away? Here’s Why Investors Shouldn’t Take the Summer Off.
Back in 1986, The Stock Trader’s Almanac coined the phrase “sell in May and go away” to highlight...

There are 4,740 ETFs out there. How can you choose where to put your investment dollars?
Ever tried to figure out what to order for dinner on a Friday night? Perhaps you can relate to the...

The Same Stream Twice

Mann on the Street
“My wallpaper and I are fighting a duel to the death. One or the other of us has got to go.”
–...