
On November 10, 2022, the S&P 500 gained 5.54%, the largest rally since April 2020. This jump prompted several clients to ask if the market had finally reached the bottom. Of course, we’d love to shout from the rooftops that the worst is behind us. But no one knows for sure what may happen in the future.
However, since we also love to analyze data, we dove right in to ascertain a reasonable answer. First, we looked at the largest one-day jumps in history and how the market fared in the 1-month, 3-month, and 1-year periods. Here’s what we found:
Largest historical one-day percent gains
Most of the top 15 daily percent gains occurred during the Great Depression. But five of the top 15 occurred in more recent history (gray rows).1
We found that generally, the market was higher one year after those recent occurrences. These rises are notable because the market fell in the short term (1 month and 3 months) in 1987 and both of the 2008 instances and only rose in the 2020 instances.1
Largest Daily Percent Gains
| Rank | Date | % Change | Return in | ||||
|---|---|---|---|---|---|---|---|
| 1 mo | 3 mo | 1 yr | |||||
| 1 | 3/15/1933 | 16.61 | -2.0% | 53.7% | 61.1% | ||
| 2 | 10/30/1929 | 12.53 | -9.0% | -2.3% | -23.7% | ||
| 3 | 10/6/1931 | 12.36 | 8.8% | -23.8% | -31.4% | ||
| 4 | 9/21/1932 | 11.81 | -15.1% | -20.0% | 25.5% | ||
| 5 | 10/13/2008 | 11.58 | -15.1% | -13.3% | 7.3% | ||
| 6 | 10/28/2008 | 10.79 | -5.6% | -10.1% | 13.1% | ||
| 7 | 9/5/1939 | 9.63 | 1.2% | -2.8% | -14.7% | ||
| 8 | 4/20/1933 | 9.52 | 12.8% | 48.3% | 41.3% | ||
| 9 | 3/24/2020 | 9.38 | 14.3% | 27.9% | 59.8% | ||
| 10 | 3/13/2020 | 9.29 | 2.9% | 12.2% | 45.5% | ||
| 11 | 10/21/1987 | 9.1 | -6.3% | -6.1% | 7.3% | ||
| 12 | 11/14/1929 | 8.95 | 12.8% | 21.4% | -13.9% | ||
| 13 | 8/3/1932 | 8.86 | 38.3% | 2.0% | 64.2% | ||
| 14 | 10/8/1931 | 8.59 | 7.1% | -22.6% | -38.3% | ||
| 15 | 2/13/1932 | 8.37 | -2.3% | -34.1% | -24.2% | ||
Data sourced from wikipedia.org, accessed Nov 10, 2022. Return calculations by Motley Fool Wealth Management.
Most significant one-day gains during similar economic environments
However, during those years, we believe specific triggers caused the market to decline: 1987’s Black Monday, the bursting of the housing bubble in 2008, and COVID-19 which closed economies in 2020.
Today, the market’s decline generally reflects geopolitical issues and economic woes. So, we looked at years with similar conditions to what we’re facing today—high inflation, rising interest rates, and a possible (looming) recession. We chose three periods that we felt generally resemble today—1980-1982, 1973-1974, and 1968-1970.
Largest Daily Percent Gains by Year
| Year | Date | % Change | 1-Mo Return | 3-Mo Return | 1-Yr Return |
|---|---|---|---|---|---|
| 1982 | 8/17/1982 | 4.76 | 13.5% | 24.2% | 49.9% |
| 1981 | 3/12/1981 | 2.49 | 1.0% | -2.9% | -17.9% |
| 1980 | 4/22/1980 | 3.64 | 2.7% | 11.9% | 33.0% |
| 1974 | 10/9/1974 | 4.6 | 10.5% | 3.3% | 29.8% |
| 1973 | 12/26/1973 | 3.06 | 0.9% | 2.0% | -30.1% |
| 1970 | 5/27/1970 | 5.02 | 1.0% | 11.6% | 36.9% |
| 1969 | 7/31/1969 | 2.11 | 4.0% | 5.6% | -15.0% |
| 1968 | 4/1/1968 | 2.53 | 5.6% | 7.7% | 9.8% |
Data sourced from wikipedia.org, accessed Nov 10, 2022. Return calculations by Motley Fool Wealth Management
Our data show two specific findings in environments we believe are generally similar to today:
- After a sizeable daily gain, the market was up one year later in five out of eight years
- But each period had a single year (1969, 1973, 1981) that was negative a year later
We know this doesn’t answer the question about nearing the bottom because no one knows until after the fact. But if these data tell us anything, in many cases, in a general sense, the market has historically been higher one year after a significant daily gain. Will it happen after last week’s huge day? We cannot predict the future and affirmatively say yes, but we hope so!
Longer really can be better
These data only tell us what happened in the short term. But we believe in long-term investing. It’s not a catchphrase to us—we think it improves your chances of not losing money.
Long-term investing can potentially smooth negative or low-returning years with high ones. And since we know that the market tends to go up over time, the longer you stay in, we believe your chance of losing money should generally decline.
For example, if you look at history going back to the creation of the S&P 500 index in 1957, the data show that if you would have invested in a fund that tracked the S&P 500 for any 5-year period from then until 2022, your chance of losing money was approximately 10%, which means your chance of a positive return should have been 90%.2
But for longer periods over five years, the chance of a positive return should have been even higher than 90%. For instance, you had a 99.88% of achieving a positive return when you invested in the S&P 500 for 15 years or longer during any 15-year period from 1957 to 2022. That’s because, for every 15-year period, the chance of a negative return was only 0.12%.2 But it is prudent to remember that all investments involve risk and may lose money (including principal). Past returns are no guarantee of future returns.
Best after-worst day analysis
Along with a long-term philosophy, we also adhere to the investing mantra that time in the market is better than trying to time the market. What do we mean?
As we said, no one knows when the market will bottom and turn. Maybe it was last week. Maybe not.
But we believe that the market often turns quickly. For example, over the past 20 years (2002-2021), research shows that six of the seven best days occurred after the worst day.3
| Date | Decline | Next Day's Move |
|---|---|---|
| 3/16/2020 | -11.98% | 6.00% |
| 3/12/2020 | -9.51% | 9.29% |
| 10/15/2008 | -9.03% | 4.25% |
| 12/01/2008 | -8.93% | 3.99% |
| 9/29/2008 | -8.79% | 5.42% |
| 3/9/2020 | -7.60% | 4.94% |
| 10/9/2008 | -7.62% | -1.18% |
| 11/20/2008 | -6.71% | 6.32% |
| 8/8/2011 | -6.66% | 4.74% |
| 11/19/2008 | -6.12% | -6.71% |
| 10/22/2008 | -6.10% | 1.26% |
Data from CapitalIQ. Data from Jan. 3, 1928 through Nov. 10, 2022
So if you’re out of the market and miss the worst days, generally, you’ll probably also miss the best days. And if you missed 10 of the best days from 2002-2021, your 20-year return was likely nearly halved. This is because fearful selling tends to keep investors out of the market for too long, and they typically can give up a lot of opportunities in the early days of a recovery.
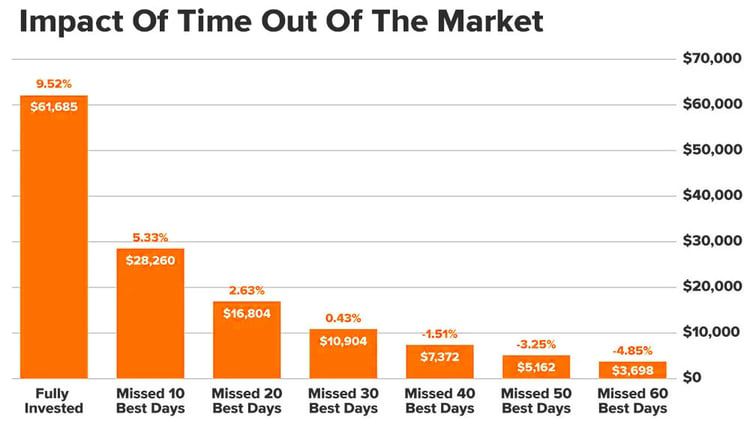
Source: JP Morgan Asset Management. The dollar amount shows the performance of a $10,000 investment between Jan. 1, 2002 and Dec. 31, 2021. Returns are based on the S&P 500 Total Return Index. Indices do not include fees or operating expenses and are not available for investment. The hypothetical performance calculations are shown for illustrative purposes only and are not meant to be representative of actual results while investing over the time periods shown. Calculations are gross of fees but include reinvested dividends. Hypothetical performance do not reflect actual trading, liquidity constraints, fees and other costs and may not account for the impact of certain market factors such as lack of liquidity. Simulated trading programs are designed with the benefit of hindsight. Returns will fluctuate and an investment upon redemption may be worth more or less than its original value. Past performance is not indicative of future results.
Related Posts

Sell in May and Go Away? Here’s Why Investors Shouldn’t Take the Summer Off.
Back in 1986, The Stock Trader’s Almanac coined the phrase “sell in May and go away” to highlight...

There are 4,740 ETFs out there. How can you choose where to put your investment dollars?
Ever tried to figure out what to order for dinner on a Friday night? Perhaps you can relate to the...

The Same Stream Twice

Mann on the Street
“My wallpaper and I are fighting a duel to the death. One or the other of us has got to go.”
–...